Solar Measurements
I am experimenting with measurements of solar radiation, based on a modified Oregon Scientific THGR810 temperature/Humidity sensor. Normally, this sensor would measure temperature and humidity and relay them to the Oregon WMR200 head unit by wireless connection.
The modification is to replace the temperature sensor (normally a thermistor) with a light sensor - in this case a photo diode and some associated components. The photo diode has proved to reach its limit in bright/overcast conditions, so at present there is a 4x neutral densite optical filter in front of it to reduce the light level. This is still not dark enough and a darker filter is on order.
Once I achieve a set-up which works in all normal light levels, I will turn my attention to the task of calibrating it! At present it is uncalibrated and the actual readings should be taken as comparative only.
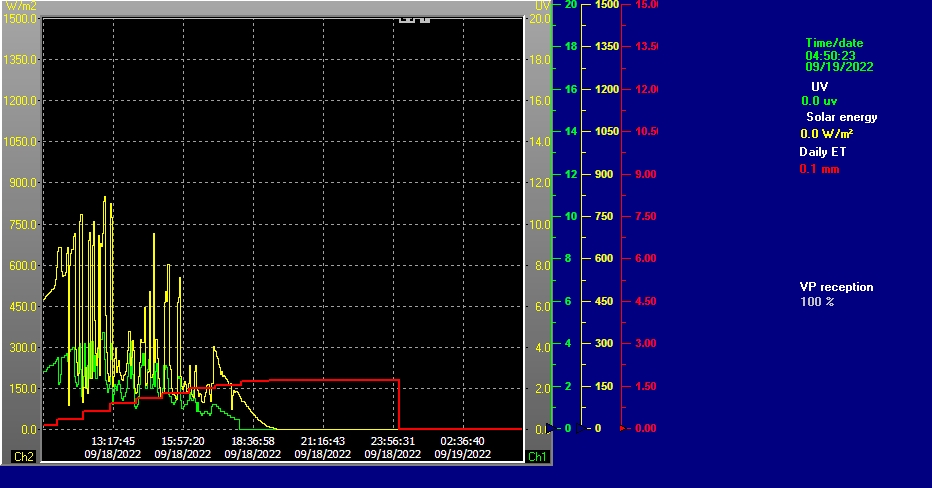
Graph 1 - Solar energy, UV and ET
Solar energy (yellow line) - this graph is produced by taking the reading from the solar sensor, converting that to a percentage of the maximum solar reading and then applying that %age to the theoretical maximum solar energy in W/m2 for our latitude and time/date.
UV Index (green line) - The UVI reading comes from a purpose-made Oregon Scientific UV sensor and should be accurate. Note that there is currently a problem with the Y-axis range - I don't seriously expect to see a UVI of 100 - at least I hope not! - I Think this is now fixed, I'll try it for a few days.
ET (red line) - ET or evapotranspiration consists of two components, evaporation of water from the earth's surface (including lakes and other bodies of water) and transpiration of water from the leaves of plants. It is an important element in the water cycle and is useful (for example) in indicating how much you need to water your garden. ET is measured in mm. The ET value given here is calculated from various other readings taken by the weather station. At the moment, the reading is reset at 5.00 each morning.
Graph 2 - Solar "temp" and humidity 2.
Solar "temp" (green line) - this is the raw reading from the modified temperature sensor and is actually a measurement of light level. The saturation level for the photo diode is about 20.3C on this scale and the minimum (i.e. dark) reading with the present set-up is about 10.2C.
Humidity 2 (yellow line) - in a sense this is a redundant reading, however it serves to illustrate the sensitivity of the humidity reading to the siting of the sensor. This sensor agrees with the main sensor if they are side by side. In fact they are only about 3m apart, this one being on the garage roof in full sun and the main one being located in shade and above soil.