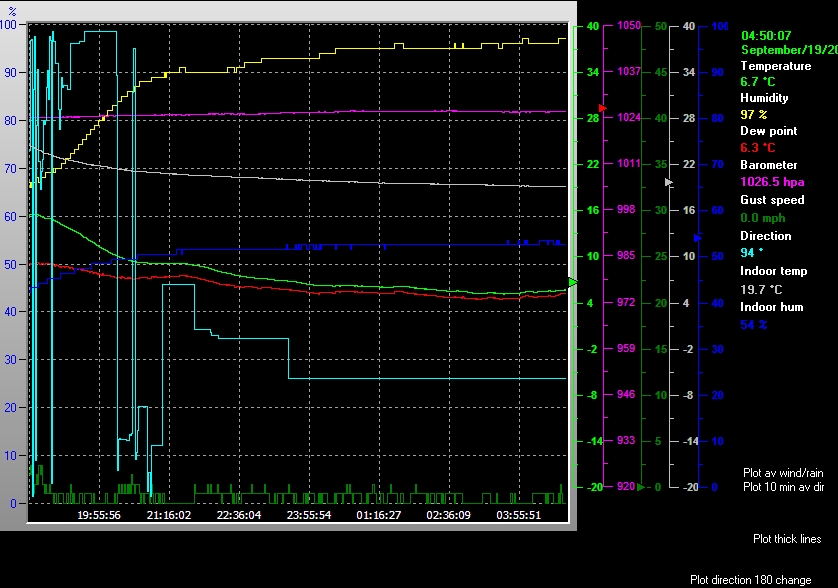
Real-Time graph
The following is a plot of weather station readings over the past few hours. At the moment this tends to be dominated by the wind direction plot, which tends to be all over the place in breezy conditions. It also lacks a scale, which isn't particularly helpful! I will be looking into improving this, but it isn't high on the priority list!